
Middleby Corporation (NASDAQ:MIDD)
Restauranteur Essential

Introduction
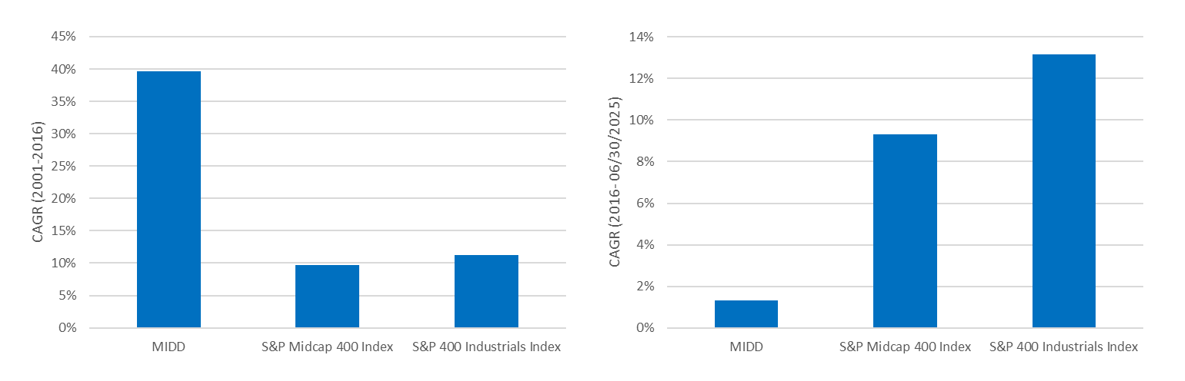
Early in my investment career, I read an article about Middleby Corporation, under Selim Bassoul’s leadership, which generated a 39.7% CAGR for shareholders over 15 years (2001-2016). A popular podcast with Brian Bares also praised Selim; he said
“I would say, a 10/10 manager for better part of two decades. He’s probably the best manager that we’d ever come across. If we ever had to write the next outsiders’ book with– I’m blanking on the name even though I know him. But anyway, if we had to write chapter 1 of the next outsiders’ book, we probably put Selim Bassoul of Middleby as chapter 1. He was just phenomenal. He had the full talent stack.”
Unfortunately, things change. Since late 2016, the stock delivered an 11.79% total return over 8.5 years. This is underperforming the S&P Midcap 400 and S&P 400 Industrials Index, as shown in Figure AA below.
Investors were patient for years, but opinions changed given the data. In early 2025, activist investor Ed Garden saw an opportunity to clean up the business, perceived to try to do too much and not much of it well. Garden Investments entered into an agreement with the company and now has a board seat.
Bottom Line
The worst is behind the company after facing years of headwinds from restaurant closures, slower customer buying and weaker remodeling activity. Core equipment at the customer base is now approaching the end of life and has already been pushed out – a replacement cycle will unfold sooner than the market is expecting. The market is extrapolating lower organic growth, underappreciates SOTP math on the upcoming spin-off of the food processing segment and a dramatically different capital allocation approach going forward. At $132 share price, the risk-reward for the stock looks favorable, and a replacement cycle for the core CFS business should support growth over the next 24 months. I estimate the intrinsic value of the stock at >$160 per share, with a bull case of $220/share.
Middleby Corporation Overview
Middleby Corporation is a global leader in design, manufacturing, marketing, distribution, and service of a broad range of food equipment. They focus on three segments: Commercial Foodservice Equipment (CFS), Food Processing (FP), and Residential Kitchen (RK). Middleby owns or leases over 82 facilities globally serving thousands of customers, including McDonald’s, Burger King, Chipotle, Costco, Kroger, and Marriott. MIDD has over 110 brands. Figure AB below shows a sample from their June 2024 investor presentation. MIDD’s equipment plays an essential role in preparing food around the world. Good consumer outcomes depend on this equipment’s reliability and performance.

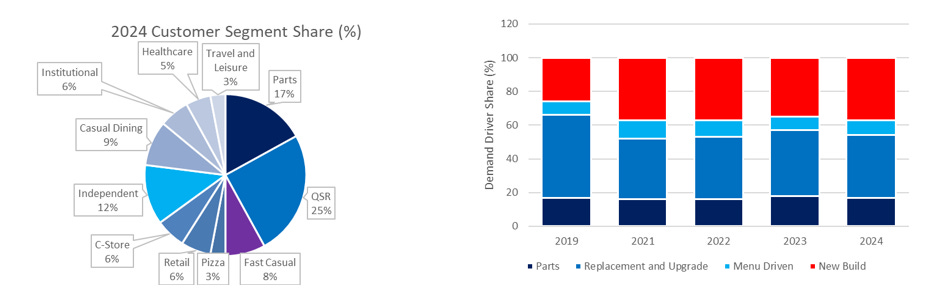
Figure AC illustrates the demand driver breakdown. The two biggest drivers over the past three years have been replacement and upgrade activity and new build activity. The stoves and ovens at the back of a restaurant won’t last forever, and if more locations are built, these new restaurants will typically (but not always) purchase new equipment. This activity in turn will drive sales for MIDD. On a T4Y basis, replacement has represented 37% of sales, new builds 37%, menu driven 10%, and parts ~17%. Given 64% of T4Y sales were driven by demand drivers outside of new builds, overall cyclicality should be muted in most economic scenarios.
Most of Middleby’s historical top-line and bottom-line growth was due to M&A. This was a roll-up story, one of the first serial acquirers. It started in 1888 by Joseph Middleby and John Marshall, who made custom portable ovens for Chicago area. An excerpt from the 1997 IPO filing provides a brief history.
“in the early 1980s positioned itself as a leading foodservice equipment manufacturer by introducing the conveyor oven that revolutionized the pizza market. In 1989, the Company became a broad line equipment manufacturer through the acquisition of the Foodservice Equipment Group of Hussmann Corporation, which included CTX, Southbend, SteamMaster and Toastmaster. The Company initiated its international distribution and service strategy in 1990 by acquiring a controlling interest in Asbury. In 1991, the Company established Middleby Philippines to provide custom kitchen fabrication and specialty cooking equipment to restaurant and hotel chains in the Asian, Pacific Rim and Middle Eastern markets.”
Commercial Foodservice (CFS)
Starting with the biggest segment, Commercial Foodservice (CFS). The segment’s portfolio is wide – covering ovens, ranges, fryers, ventilation equipment, fridges, ice machines, cold rooms and dessert equipment. If you’ve seen equipment in a restaurant at least some of it is likely from Middleby. Experts say MIDD’s offerings can cover 90% of a kitchen’s needs.
CFS’s customer base includes restaurants, convenience stores, supermarkets, hotels, stadiums, and cafeterias, including QSR brands like KFC and Burger King. They market this segment with 75+ brands and primarily through non-exclusive distributors. MIDD supplements this with representatives to drive sales but only with the largest multi-chain units like McDonald’s and Yum Brands. Despite some bigger customers, the largest isn’t over 10% of net sales. Companies and buying groups like Edward Don (owned by Sysco), TriMark, and Clark Associates facilitate a large number of sales using a scale-economies-shared model to help independent restaurants and smaller chains get similar discounts as larger chains.
Demand drivers for the segment are new store openings, remodeling activity (mostly new equipment), and the age of the installed base. The replacement cycle for core equipment is around 7-10 years, giving MIDD decent visibility on future demand. Mix shifts within channels like convenience stores offering more prepared food have driven incremental sales – e.g., Subway didn’t have toasters 25 years ago, now they do. Circle K or Casey’s sold less warm/hot food a decade ago but are reinvesting to expand their food & beverage offerings. Geographic expansions also drive sales – if KFC scales up in Spain, they will bias towards equipment used in the USA for a standardized global offering.
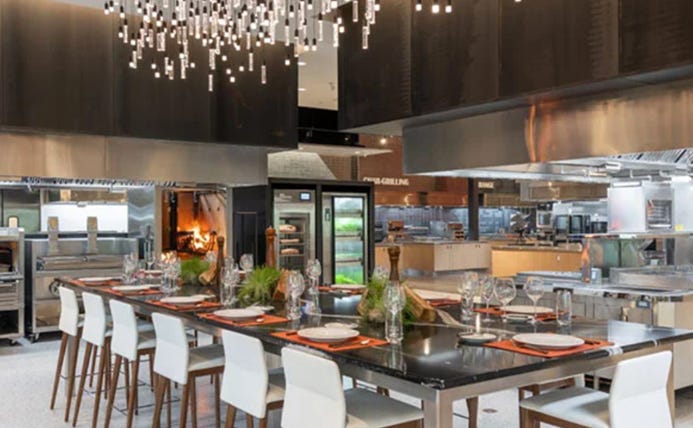
The CFS segment has Innovation Kitchens around the world, where they showcase over 150 pieces of equipment. The main value proposition is that restaurateurs can see a full range of popular equipment, experience its use, and get more hands-on learning. With sales scaling in Europe, they added a third innovation kitchen in Munich to support future growth in the region. Figure AD below shows part of the Dallas Fort Worth showroom.
Food Processing (FPS)
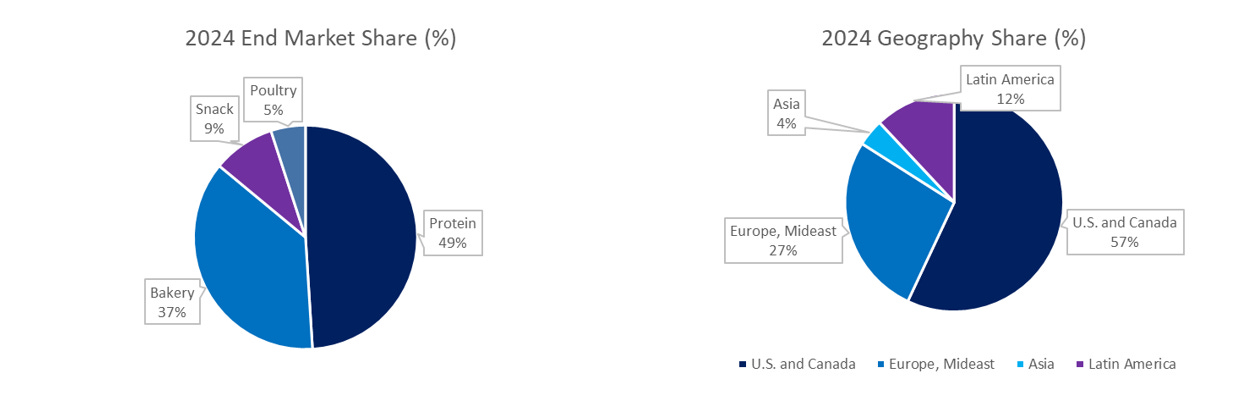
The next largest segment is Food Processing, which management plans to spin out in 2026. The segment sells protein processing, bread production, snack, and poultry processing equipment, typically built into automated solutions. Key considerations for choosing the equipment include processing speed, raw material waste, ownership cost, automation, and power consumption. Major verticals they sell to include protein processors, bakeries, snack producers, and poultry processors as shown in Figure AE. In contrast to CFS, aftermarket sales & service are much higher at 33% due to higher utilization (24/7) and routine maintenance. FP customers focus on maximizing ROI and understand the upfront costs for performance improvements. Their buying processes skew more sophisticated and involve RFPs in most cases.
Demand for equipment stems from upgrade or replacement cycles while end product demand grows along with increasing consumer purchasing power. The consumption of pre-cooked chicken, deli trays, frozen foods, and other ready-to-eat foods gradually grows in most places as countries industrialize, or consumer incomes grow. Figure AF below provides a sample of some of the equipment showcased early in 2025 from the segment.

Residential Kitchen (RK)
Residential Kitchen segment is the last we’ll cover. MIDD entered this market by acquiring Viking Range in 2013 and expanded the portfolio with additional M&A. This portfolio skews to premium residential products. Initially focused on indoor ranges, they now offer outdoor grilling equipment, induction stove tops, refrigeration, and ovens. Unlike other segments, sales here are (indirectly) consumer-facing, not company or small business-facing. Figure AG below shows the brands and a Viking range.
Competitive Advantage & Go to Market Approach
MIDD’s competitive position is largely driven by intangible assets (brand portfolio and R&D), and modest switching costs. Underpinning the portfolio is >80 brands which are generally market leading products and a reputation with key customers that creates some level of recurring purchases. Additionally, the installed based of +250,000 units with these key customers continues to grow providing a steady source of higher margin aftermarket parts and service revenues. Management has faced scrutiny from analysts and investors regarding the ownership benefits and true synergies of owning all three segments. I see cost or scale benefits with raw materials sourcing or R&D cost sharing but otherwise don’t see major synergies - management seems much more open to cleaning up the portfolio today than historically.
MIDD has limited customer overlap amongst the different segments, leading to different go-to-market approaches. In Commercial Foodservice, they use company-owned and indirect dealers for most of the market, but they also work directly with the largest chains. In Food Processing, regional sales managers closely consult with customers on equipment for the highest ROI. Residential Kitchen sells to retailers, distributors, designers, and home builders. Management seems to believe they are good consolidators and operators and regularly determine if they are the best owner for a particular brand or segment. In recent investor calls, they indicated that once Residential Kitchen is large enough and closer to mid/late cycle margins, there’s potential for monetization or spin-off. Ed Garden is apparently interested in seeing RK business getting sold or split off from MIDD over time. Exhibit AH below outlines the channels, and different go-to-market approaches.

Track Record
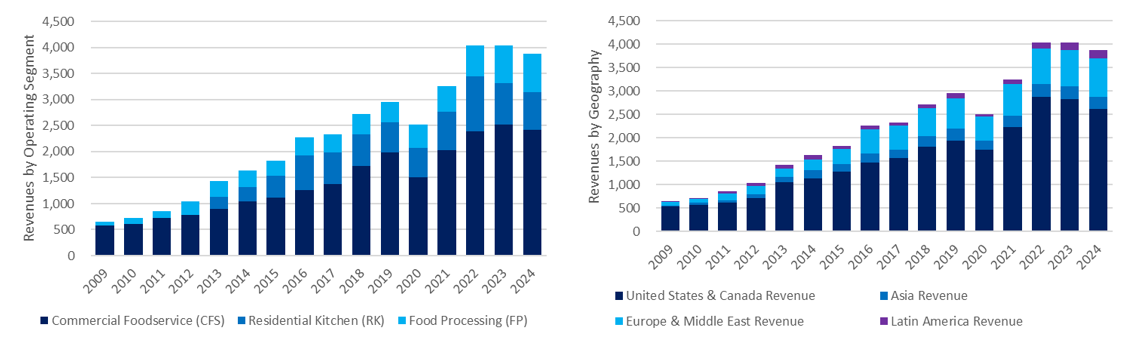
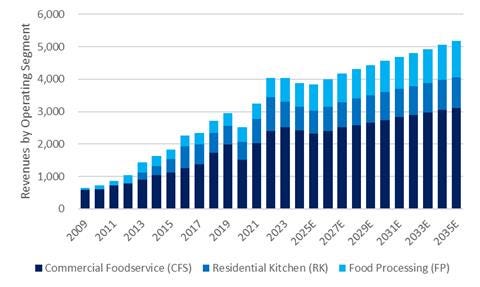
From 2009 to 2024, MIDD delivered a corporate revenue CAGR of ~12.7%. CFS grew at a 10% CAGR, and FP grew at a 17.4% CAGR – from the initial acquisition in Residential Kitchens in 2012, grew at a 10.9% CAGR into 2024. The CFS segment went from ~90% of sales in 2009 to 62% by 2024 as the other segments grew. Figure AI below shows revenue by segment and geography over this period.
To highlight the importance of M&A, I’ve broken out the contributions from M&A, Organic Growth, and Other (FX, other etc.) in Figure AJ. Organic growth (pricing, volume, mix) was +1.6%. M&A was the primary driver of sales growth contributing +8.3%, and other factors contributed 2.7%. While list pricing increased likely in the 2-4% range, after negotiations and volume discounts the 1.6% figure looks reasonable. I don’t believe they have lost material share to competitors across the portfolio, and if anything they have gained some share from Wellbilt (now owned by Ali Group) – anecdotes from executives in the space also suggest they have continued to lead with innovation which would make share losses more puzzling. But, there’s no hiding that organic trends have continued to decelerate over time – as the replacement cycle for most equipment has continued to be delayed or pushed out in the last five years.

As another way to assess the company’s organic growth, below we look at Same Store Sales (SSS) growth across about 10 customers. Data below in Figure AK shows a relatively strong relationship between at least half of these customers own SSS and the company’s Commercial Food Service segments organic growth (%) – with 5 customers including YUM, SBUX, DRI, DINE showing >70% R^2. If we index the total level of sales growth for MIDD vs this group, we can see the sales have largely been in-line with broader industry trends – from 2010 to 2024, the group saw average comp sales up from 100 to a median 150, vs MIDD which grew to 147. This indicates fair performance relative to the industry and doesn’t imply meaningful share losses.
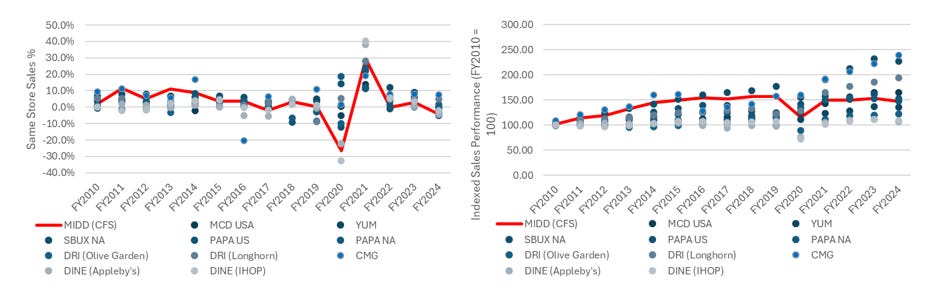
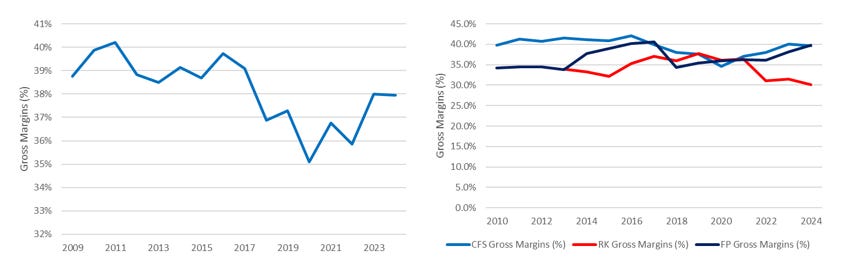
Figure AL below shows MIDD’s gross margin history on a corporate basis and for all segments. Gross margins peaked in 2016 at 39.7%, but since then product rationalization, acquisition integration/mix, and lower sales volumes have posed challenges. Individual segment margins peaked in 2017-2019, then generally recovered by 2024, except for Residential Kitchen which struggled amidst lower housing turnover and new build activity. In 2024, Residential Kitchen reported gross margins of 30.2%, down 760 bps from the peak due to a weaker environment and a modest impact from mix changes. Management also discussed instances where poor pricing contracts on backlog and higher cost inflation led to weaker margins over the last 4 years.
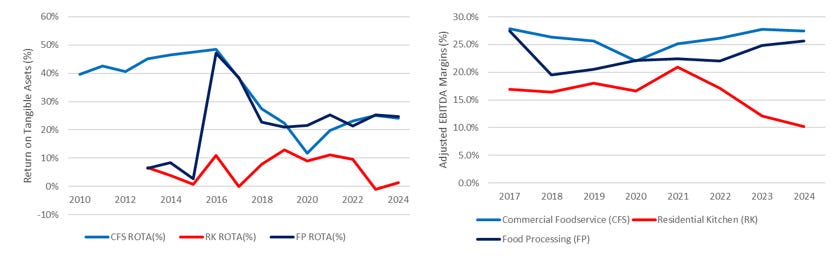
Gross margins aren’t the full story. MIDD reports segment assets, goodwill, and income from operations which can be used to calculate a rough Return on Tangible Assets (Total Assets Less Goodwill). Figure AM shows CFS segment went through three periods – improving returns from 2010-2016, steady declines into 2020, then a gradual recovery. FP faced similar trends but has been more stable due to less customer disruption. The RK segment has never generated great returns on tangible assets, only rare periods reaching ~10%, then the purchase of outdoor cooking equipment near the cycle’s peak created subsequent headwinds. Adjusted EBITDA margin trends since 2017 show a similar picture.
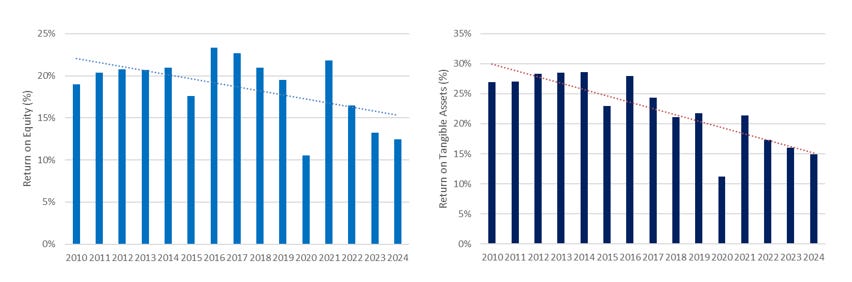
MIDD’s economics have gradually deteriorated. Corporate ROEs were >20%, but since averaged 16%, declining to ~12% in 2024 as shown in Figure AN. The spread between their earnings and whatever reasonable hurdle rate you use for their cost of capital is much smaller today. The Return on Tangible Assets (Total Assets Less Goodwill and Other Intangible) shows a similar trend with ROTA (%) in the 21-29% from 2010 to 2018, but only ~15% in 2024. Three macro factors drove this weaker performance: uncertainty affecting restaurant or franchise owners’ reinvestment confidence which translated into lower sales volumes. Record restaurant closures during COVID-19 eliminated a large number of customers and flooded the market with used equipment. Also, broader cost inflation drove higher pricing at a time when demand was also weak - higher pricing vs low demand is a dynamic that persists today.
M&A Engine
Since 2001, MIDD was scaling up acquisitions. However, since a peak in 2018 at 8 deals including one large deal, Taylor - management has slowed the pace of acquisitions as shown in Figure AO. Most deals have been smaller with average revenues per deal in the $20-$80m range. Multiples paid averaged 1.2x on a EV/Sales basis excluding the 8 largest deals or 1.4x including them. The capital deployed relative to cash flow from operations has only been >100% in 10 of the past 24 years.

The prior roll-up strategy focused on smaller tuck-in deals leaving integration manageable in general, and avoided larger bets that could really threaten the overall performance of the company. This changed started in 2018 with Taylor a $1b deal, then in 2021 they attempted to complete a transformative merger with Wellbilt, a competitor in commercial kitchens. However, this deal didn’t go through as Ali Group emerged as a competing bidder and was willing to pay more for the asset. While walking away from the deal showed some financial discipline, and the receipt of the $110m break free was a short term win. After this deal, they have reverted to more of the smaller-mid sized deals with a large skew towards the Food Processing segment. I view this positively, given most deals were again refocusing upon niche opportunities like automation, technology and cold/beverage where the current portfolio still has some gaps.
Below in Figure AP, we show the 8 largest deals the company completed starting in 2001. By a large, margin, the acquisition of Taylor at $1b was the largest and should have had the most explanatory power in how the underlying returns of the business have deteriorated. The timing of Selim’s exit in 2019, suggests this might have been the blunder which drove his departure. Back in 2013, Selim said
“ Well, I can tell you the reasons that we don’t make an acquisition. Growth, or size, or buying a market. So all those three reasons, we will not go after an acquisition to buy a market.”
It’s hard not to consider the Taylor acquisition as buying into beverage, soft serve and frozen drinks market. Some estimates indicate they have ~18% share in global soft serve, and are by far the global leader. On the frozen drink and beverage size, Taylor is also estimated to have a mid-teens market share in the market. To me this shows some inconsistency in the execution of this strategy over time. Even the headline EV/EBITDA multiple of 15.4x, was expensive in my opinion.

In general, it looks like the deal activity has gone through better phases of returns but also weaker periods (part of which can be explained by broader industry headwinds). But, I’m inclined to believe managements previous comments that smaller deals with a focus on a niche technology or capability that can be rolled out globally or integrated into other products should generate attractive returns. Proctor & Gamble had used a similar approach of buying regional brands, then vastly improving its sales penetration with existing customers around the world – I see why that same approach could work with MIDD and generate good returns.
Industry Trends
The US Census provides data on food consumption at home and away from home. I’ll say that there are blurred lines between the categories as grocery stores may sell hot ready-to-eat food at the deli or prepared food counter, but this is a small figure overall – we can ignore it as broader trends are more meaningful. Exhibit AQ shows the trend of spending on food away from home and at home. US consumers have increasingly spent more money on food at restaurants, bars and other venues. This briefly reversed during COVID-19 when most restaurants were closed or ran at lower capacity. This trend has supported demand for commercial foodservice equipment, and this trend has been in place for over 30 years. An estimated 56% of disposable income spent on food in the US is spent on eating outside the home. The pie is growing.

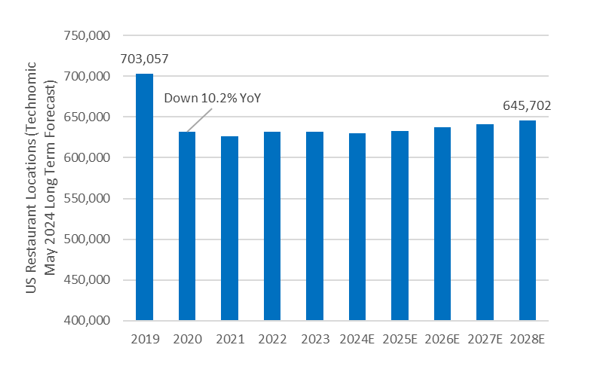
Below we look at how the number of restaurants in the US has evolved over time in Figure AR. This shows a relatively stable growth rate over time – from 2005 to the peak in 2019 the data shows a 1.7% CAGR, and from 2005 to 2024 the data shows a 1% CAGR. Due to the pandemic, about 75,000 restaurants have been closed. From what I understand, the most impacted categories were full-service, luxury and food truck restaurants. Collectively, less social activity, business travel and public gatherings along with a sharp rise in operational complexity, and staffing challenges lead to closures. In general, larger chains did better on a relative basis, because of an ability to adapt their business models (staffing/takeaway), buying power and access to capital.

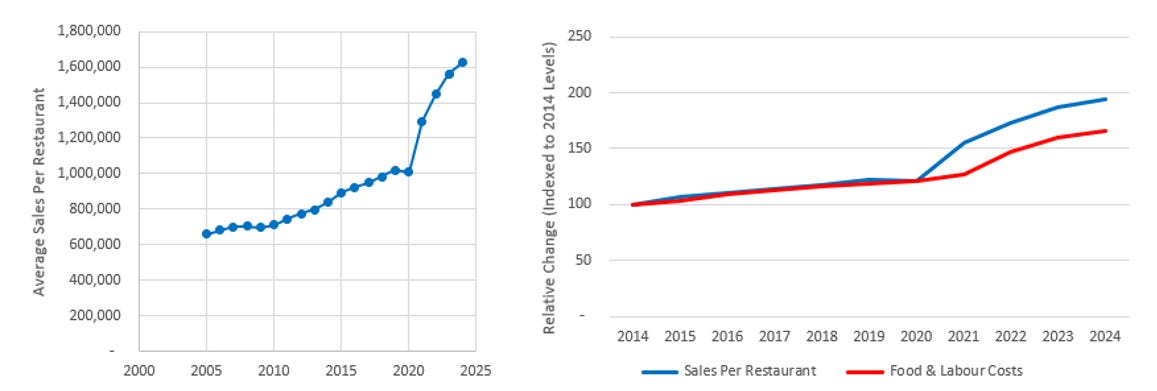
If we combined the two data series, we could calculate the average sales per US location as shown in Figure AS. The average store of the surviving restaurants has seen a 59% increase in sales from 2019 levels. However, I think margins are likely down due to food (raw material) costs up 27%, and labor costs up 15% from 2019. It’s hard to find lower costs – packaging, insurance, and advertising costs are up. I think most restaurants will lower margins today.
MIDD management believes they are in generally modestly growing markets – they paint a picture somewhat more optimistic that what I’ve shown above. From 2015 to 2024, the total addressable market for the CFS has grown at a 1.7% CAGR, RK grown at a 3.1% CAGR and FP at a 3.1% CAGR as show in Figure AT. Then from this data, we can calculate a very rough market share for each of the segments based on segment sales. For Both CFS and FP segments, it is clear that they have continued to penetrate markets through a combination of organic growth or M&A. Residential Kitchen (RK) on the other hand, is only up modestly from 2015 despite a number of acquisitions, but perhaps this is more of an indication of how the premium/high end market has performed over time.

The industry is seeing a long-term trend of more food being eaten away from home. I don’t see any major reasons for this to change. Preparing food is time-consuming, costly, and most people lack the skills or willingness to create a quality meal. The main negative appears to be from a health perspective, but that could be offset with GLP1s but also restaurants are shifting menus to be healthier. Make America Healthier trends could support a broader quality improvement in the food chain. Most restaurants still face cost headwinds. One lever they can pull is investing in boosting efficiency per worker – better or automated preparation equipment, and self-serve kiosks or higher digital order penetration. The best path for the industry is to invest more into automation, digital and connected solutions - all areas where MIDD is well positioned. Figure AU shows the 6 characteristics that MIDD customers want when purchasing equipment.

A long-term tailwind towards more eating away from home is likely to continue. Despite a decrease in total restaurants in the recent past, growth expectations from consultants like Technomic calling for a 0.4% CAGR into 2028 seem reasonable. Overall, MIDD is in end markets with modest organic growth, consolidation opportunities, and broader tailwinds.
What am I comfortable underwriting?
To help assess valuation, I walk through my core assumptions below. Many of these assumptions look reasonable for the company to achieve given the current outlook, and my understanding of the business.
From a topline perspective, MIDD has completely revamped its go-to-market strategy and has now better aligned sales representatives, dealers, consultants, service and digital tools on selling a full solution – I.E. capture more spend than in the past. Organic growth should be much better than we’ve just seen. The company had added +50 individuals focused on selling largely from competitors and vastly simplified the number of people going to customers. In the past, often a prior acquisition would have retained its sales team but only sold that solution – going forward, fewer representatives will sell a broader range of solutions and have incentives closely tied to higher margin products. MIDD’s more recent expansion of its cold, and beverage platforms also supports this shift in strategy, whereas before they did not have a solution for this equipment need. Multiple expert calls confirm the view that this shift is leading to faster selling cycles, better alignment with channels and incremental service wins.
To start, I assume that organic growth grows at ~2-2.5% per annum across the three segments, then gradually decelerates over the next decade. This drives total revenue CAGR of ~2.4% over the next decade, prior to any M&A. The next 12 months are expected to be soft in CFS and RK, but pent-up demand is expected to support growth over the medium term. The Food Processing segment is forecast to have the strongest organic growth, while Residential Kitchen lags. Core CFS business, has struggled with organic growth in the prior 5 years, largely due to COVID19 and the resulting restaurant closures. However, the industry will soon be approaching the end of asset life (7-10 years), which is already overdue – notably the 2010-2016 period generated organic growth which averaged 6.5%.
Margins have similarly been impacted by the weaker sales environment and remain below peak levels and below management’s longer-term targets. MIDD is targeting 25% EBITDA margins in Residential Kitchen, 25% EBITDA margins for Food Processing and 30% for Commercial Foodservice. Figure AX below outlines my EBITDA margin expectations into 2035 – with RK and CFS segments reaching then maintaining margins at targeted levels. RK margins improve but lag management’s longer expectations, and remain closer to peer levels.
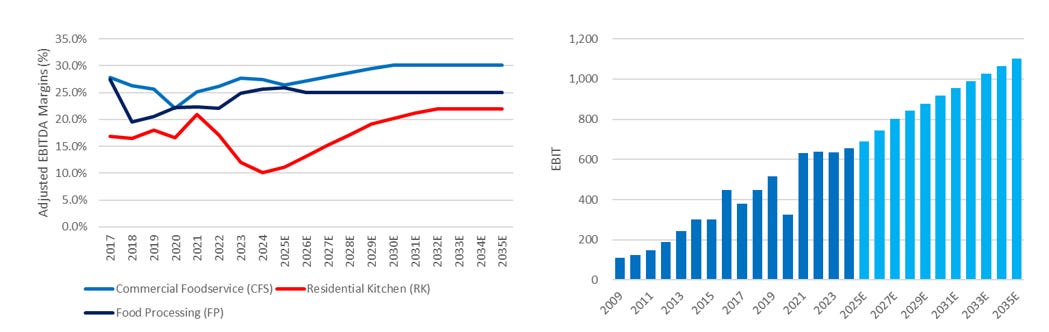
Using these assumptions, along with normalized capex estimates and improvements in the company’s working capital position towards historical operating levels, I get to an EBIT CAGR of ~4.8% from 2024 to 2035, as shown in figure AX above. Also, this does not incorporate M&A, which I still expect but much more tuck-in or technology driven going forward. This scenario generates $8.6b in cumulative CFO, ~$800m in capex, leaving >$7b in cash which can be returned to shareholders via dividends or buybacks.
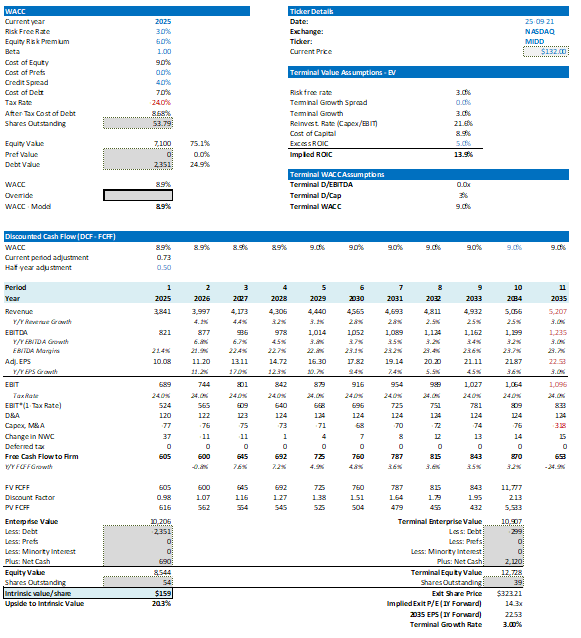
In the DCF model, we use an 8.5% cost of equity, a 6.5% cost of debt, and a terminal ROIC of about 13%. Using these assumptions, the terminal EV/EBITDA multiple is about 9.1x and the P/E is about 14x, which is similar to roughly 10.8x and 15x multiples, respectively, that MIDD trades at today. Figure AY below outlines a summary of my DCF output and see below for a copy of my financial model.
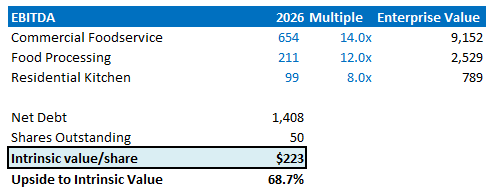
In an attempt to cross-reference my output, I apply conservative peer multiples for each of the segments. This acts as a check on the above output, and provides a glimpse at what these set of assets could be valued if they operated as separate entities. This means the conglomerate discount is removed in effect – CFS trades similar to SMID industrials with similar growth/margins, FP trades similar to JBT Marel and RK trades at a premium to its consumer appliance peers due to better margin profile and premium positioning. My math below suggests >$220 per share in intrinsic value.
Management and Governance
Middleby shifted their capital allocation philosophy at the beginning of the year. The following quote captures their current view:
“This framework, combined with our financial strength, positions us to be able to prioritize return of capital to shareholders, while also continuing investments in our business to drive innovation and deliver organic growth. To that end, and given our continued belief that Middleby’s current market valuation does not reflect the inherent strength of our business, we are now targeting a return of the vast majority of Middleby’s free cash flow to shareholders through share repurchases over the foreseeable future. This is an important part of advancing our efforts to drive enhanced value creation and follows our February announcement regarding the planned separation of Middleby Food Processing, which remains on track for completion in early 2026.”
“In conjunction with the increased emphasis on buyback activity, Middleby’s Board has increased the total share repurchase authorization by 7.5 million shares. The total authorized shares available to be repurchased now represents 11.4 million shares, or 21% of the company’s outstanding equity. Year to date, we have repurchased approximately $50 million of our stock in the open market.”
Now let’s contrast this to the 2019 approach – using a quote to illustrate the difference.
I mean, acquisitions continue to remain a strategic focus and priority of Middleby. Obviously, we’ve been executing on that strategy for the better part of 20 years. And certainly, last year and this year has been no different. I think we’ve added six new great brands and technologies to Middleby this year. So we see opportunities across all three segments. We’re very focused in terms of strategic adds to the portfolio…
I mean, I think from a stock buyback – I mean other than debt paydown, that’s the other area that we think about. It is opportunistic at times and it always kind of depends on obviously where the stock is trading. But really the acquisitions are what create long-term shareholder value, as opposed to a buyback, which I’m not saying it doesn’t create long-term shareholder value, because it certainly does, but it’s a bit more of a financial buy. So that’s kind of the prioritization. And both of those are things that we think about on a regular basis.”
On base case estimates, MIDD will generate ~1.5b in free cash flow over the next three years, mainly from operating activities with some modest debt they can add on. MIDD management aims for 2-2.5x net leverage, and they should be able to re-leverage as the business returns to growth. Most deals will be small filling portfolio gaps – Frigomeccanica SPA is a good example; if bought for 1.2x sales, it implies a $45m purchase price. I think its completely off the table for them to attempt to complete a larger acquisition like Taylor, which would be considered transformational in nature.
In terms of incentives in 2024, management was primarily evaluated on EBITDA for short-term incentives. Longer-term equity incentives are 2/3rds based on performance PSUs, which are equally weighted on two metrics shown below along with management’s definition:

It’s surprising that management secured an 87% say on pay approval last year with these metrics. For a very acquisitive company, it’s too generous to add back restructuring and facility consolidation expenses and other one-time costs - especially each year. The adjusted EBITDA figure multiple by a market multiple doesn’t make sense – especially since mid-2022 Middleby traded at 9-12x while the market traded at a premium for the past 3 years as show in Figure BB. The incentive plan driven by these two metrics incentivizes deals that can boost both metrics without care on the ROIC or ultimate FCF from a deal.

By 2025, shareholder feedback has driven some changes. “the 2025 long-term equity incentive program will include Adjusted EPS Growth, Return on Invested Capital (ROIC), and TSR performance metrics.” I prefer FCF to be added but they are moving in the right direction.
Ed Garden is now on the board and has been accumulating shares since the year started. According to the cooperation agreement filed earlier this year, he owns ~643,000 shares personally and at least 2.6m shares through his firm. Ed Garden is well respected, has the capital allocation chops, and has a good investment track record from my preliminary research. The main areas for improvement are outlining a long-term growth algorithm and earnings power expectations – to date, they have only provided long-term margin guidance.
The board composition is improving. John Miller, the compensation committee chair for 47 years, has stepped down. Ed Garden brings a solid track record of public investing and capital allocation. Julie Bowerman adds strong public company and marketing experience, which could help improve organic growth. These two additions make it a total of 4 new directors in two years – a newer set of directors should help revitalize and reposition the business for future success.
Conclusion
A reset is underway at Middleby; pro-forma the spin of FP, a smaller portfolio will be more closely managed, an activist is closely watching capital allocation and a rebuilt go-to-market approach has encouraging potential - even the backdrop for the core customer base should improve over the next 24 months. At $132 per share, the risk-reward looks favorable, with intrinsic value estimated at $160 or $220 per share in a bull case. I welcome any feedback on the write up @icemancapital on X or via email at icemancapital@gmail.com