
A.O. Smith (NYSE:AOS)
Heat or Treat

Introduction to A. O. Smith
The origins of A. O. Smith (NYSE: AOS) (AOS) go back to 1874, when Charles Smith established C. J. Smith—Machinist in Milwaukee. At inception, the company focused on producing baby carriages and other specialized hardware. Over the ensuing years, management continued to evolve the portfolio to include things like bicycle parts, auto frames, welding rods, pressure vessels, glass-lined brewery tanks, water heater tanks, electric motors, bomb casings, propellers, and landing gear.
From 1904 to 1924, the company scaled up its operations in the automotive industry. This was in large part supported by a 10,000-unit order of steel automobile frames from Henry Ford. Shortly after this, AOS honed its process for mass manufacturing these frames and soon became the largest manufacturer in the field. By 1921, the company had created the first fully automated frame assembly plant in the world and was able to create a frame every eight seconds, or about 10,000 per day.
AOS continued to develop its portfolio over time, building on arc welding expertise to create high-pressure vessels for use in oil refining. This welding expertise eventually led to the production of large-diameter steel piping that was essential in scaling the North American oil and gas industry. But most important for the future was an innovation that allowed the company to fuse glass to steel. AOS created more than 11,000 glass-lined brewery tanks over the next 30 years. This technology was subsequently used as the industry standard in home water heater tanks for consumers.
In 1948, AOS acquired Burkay Company, entering the instantaneous commercial water heater market. About five years later, it rolled out glass-lined commercial water heater products, a first for the industry. In 1953, the company launched the Harvestore Structure product, a glass-to-steel fused storage silo used for agricultural activities. Over the next 50 years, the company installed more than 50,000 of these structures on farms around the world. In 1953, AOS acquired Glascote Products, Inc., which expanded the range of vessel manufacturing. This deal made the company the largest global manufacturer of glass-coated steel products.
By 1972, AOS began to expand globally into places like the Netherlands, Canada, China, and Mexico. In 1995, the company began a multi-year process of shedding non-core operations. The first major transaction was the sale of the automotive segment, in which it sold its US and Mexico subsidiaries to Tower Automotive. In 2001, AOS acquired State Industries, Inc., which nearly doubled the size of its water heater business. Additionally, this allowed the company to enter the retail channel for the first time in over four decades. In 2006, AOS completed the largest deal in its history, acquiring GSW Inc., a Canadian water heater and building products manufacturer. AOS established itself as the industry leader in North America through this deal.
AOS entered the water purification industry as A. O. Smith (Shanghai) Water Treatment Products Co. Ltd., starting operations in 2009. The following year, it opened a 76,000-square-foot facility in India that produces water heaters for the local market. In the United States, it entered the North American tankless market by participating in a joint venture with Takagi Industrial, a Japanese conglomerate. This partnership sold products under both the Takagi and AOS brand names. Deal activity continued in 2011, when AOS acquired Lochinvar Corporation, a leading manufacturer of high-efficiency condensing residential and commercial boilers for hot water and hydronic heating applications.
In 2016, AOS acquired Aquasana, a Texas-based manufacturer of water treatment solutions. Over the next few years, effectively all the company’s incremental deals involved regional or family-owned entities that offered water treatment products to its local customer base. In 2021, it acquired Giant Factories, Inc., a Canadian water heater business based in Quebec. In mid-2024, it acquired Pureit from Hindustan Unilever, which expanded its water treatment offerings in India. In 2024, AOS celebrated 150 years of operations and planned to operate with a focus on solutions for either water heating or water treatment.
Segment Overview
AOS sells a range of products that either heat or treat water. Its portfolio of products is mostly made up of water heaters, boilers, heat pumps, and water treatment solutions (filters, softeners, or reverse osmosis systems). AOS’s portfolio includes roughly 19 brands, including Lochinvar, Giant, Reliance, and Aquasana, among others. Most of these products are sold in North America (NA), which represented 77% of sales in 2024. The remaining 23% of sales are included in the rest of the world (ROW) segment, largely generated in China and India. Figure AA below highlights the split of sales between the two segments over the past 15 years.

From 2009 to 2024, the NA segment generated a 6.6% compound annual growth rate (CAGR) in revenues, and the ROW segment generated an 8.9% CAGR. From 2009 to 2017, the ROW segment consistently outgrew the NA segment. The consistency of performance then deteriorated following a slowdown in China due to headwinds from a weaker real estate market and impacts from the COVID 19 pandemic. In US dollar terms, ROW sales peaked in 2018 at $1.17 billion and have not recovered to this level since. Figure AB below illustrates these trends.

Economics for the NA versus ROW segments are much better, as shown in Figure AC below. NA EBIT margins are consistently stronger than 23%, while the ROW segment EBIT margins have been declining since their peak in 2014. ROW capital expenditure (CapEx) intensity has historically been much higher, but since a slowdown starting in 2018, AOS management has invested much closer to maintenance levels—in line with local market growth. Looking at return on assets (ROA) between the two segments, I see a clear difference as well. Much of this can be explained by market structure, competition intensity, and product mix, all factors I’ll dig into more later.

From a distribution perspective, NA sales have been relatively equally split between wholesaler partners and retailer partners. Ferguson, the largest customer, has been the largest wholesale partner in the United States, but it doesn’t sell exclusively to AOS. They also work with First Supply, HD Supply, and Winsupply, which collectively add up to approximately 2,400 wholesale locations in North America that sell the products to contractors. On the retail side, the largest relationship AOS has is with Lowe’s—but again, AOS doesn’t sell exclusively to just Lowe’s, they also work with Ace Hardware, Do It Best, and True Value. Retail distribution accounts for roughly 2,800 locations. All told in NA, products are sold at more than 5,100 distribution points. The top five customers represented 42% of sales in 2024, a figure that has gradually increased over the prior five years, as the largest customers have generally gained market share.
From an end-customer perspective, the underlying customer usually deals with a contractor who is sourcing the product from their preferred channel. The major difference for customers is that the warranty program tends to be about twice as good when they source through retail channels at 12 years instead of six years through wholesale. At the margin, incremental pricing changes are captured more slowly through retailer partners like Lowe’s. Finally, given the complexity of installation with both plumbing, electrical, and natural gas needs, about 90% of products are installed professionally by contractors, as most consumers are far from comfortable executing this type of project (either a replacement or new installation).
Industry Trends
The water heating industry has continued to be impacted by evolving energy efficiency regulations and decarbonization efforts. Both themes play into the broader goal of reducing the environmental impact of water heating. To manage the ever-more-stringent regulatory standards, the industry has been selling an increasing share of tankless water heaters (over tank products), high-efficiency condensing boilers (over non-condensing boilers), and heat pumps. Also, in select markets like California, natural gas–powered products are being banned after a sunset date in 2029, but this trend might unfold in more geographies over time.
Ahead of these regulations, AOS and other manufacturers have been going through an investment cycle to prepare their portfolios for this new environment. By 2026, 95% efficiency will be required in gas storage tanks and 96% efficiency will be required in gas tankless products. The sale of low-efficiency commercial gas boilers will no longer be allowed, and it is expected that these regulations will impact about 55% of the commercial units that are currently sold today. Roughly three years later, in 2029, similar changes will occur in the residential market. Thermal efficiency standards are going up, lower-efficiency natural gas tank products will no longer be sold, electric water heaters will need to incorporate heat pump technology, and gas water heaters will need to incorporate condensing gas technology. Figure AD below outlines how the US Department of Energy minimum energy efficiency standards have changed since 1990. These trends will eventually stop as the industry approaches the maximum theoretical efficiency possible.

While this new generation of products will be more expensive initially, they do appear to have a net lower total cost of ownership over the life of the assets. On recent calls, AOS management has highlighted that the switch from an electric tank water heater to a heat pump–equivalent product will result in a 2x to 3x price uplift. Even for natural gas–powered products, the switch from non-condensing gas products to condensing gas products should see something in the range of a 30% uplift on price. Consumers should still come out ahead even with this uplift as longer expected asset life and lower operating costs deflate total costs of ownership. While individual factors like the local climate, the volume of consumption, and the type and cost of fuel availability will ultimately determine the payback period. Figure AE below outlines a more extreme scenario for a payback period—using a commercial operating use case and Lochinvar’s Crest fourth-generation boiler.

I believe manufacturers should also be well positioned to come out ahead—utilities will be the main losers as this plays out. If I look back at the prior rollout of NAECA 3 standards in 2015, AOS was able to capture a price uplift of about 20%. However, the full 20% uplift didn’t occur on all volume sales—only those impacted by the new regulations. Even so, a clean drop through to industry sales didn’t transpire, as the industry often utilizes workarounds such as adding multiple units (instead of one large unit), using commercial products, or pre-buying ahead of regulatory changes. All said, the expected average selling price uplift on the next generation portfolio should help from a mix perspective and drive better revenue trends than I have seen in the past five years. Based on what I’ve heard from a few industry experts the reinvestment lift required to get product portfolios to the next generation of regulation requirements is much lighter than the past – required technology already exists and just needs to be implemented rather than design & test cycle the prior generation had to go through.
Competitive Advantages and Landscape
AOS’s competitive advantages are driven by its scale and intellectual property. From a buying perspective, it can use scale to obtain procurement advantages and scale R&D spending on larger volumes. This allows it to purchase input materials or components more inexpensively than peers and generate attractive economics. The company’s scale also allows it to meet national account needs across the country—this is important for retaining and winning accounts like the Marriott or franchise restaurants.
Starting with the NA water heater market, AOS’s share has been dropping modestly over the past decade due to the loss of Sears (retail) as a customer and the increasingly faster growth in tankless volumes. As shown in Figure AF below, the big three players continue to control more than 90% market share, but this has gradually fallen from about 95% in 2014. This headwind, however, doesn’t appear to have materially changed the attractive economics of the industry—it remains an attractive oligopoly. Regulations are also supportive of this structure, as they limit the variability of most products sold—price, capacity, and technical features tend to be very similar. However, even though selling a commodity-like product, competitors have all taken different approaches to distribution. Rheem has pursued a retail-only strategy with a partnership with Home Depot, while Bradford White has pursued a wholesale-only strategy. AOS has taken a hybrid approach, which has allowed it to generate more stable volumes throughout the cycle. Going forward, any major market share shifts in this market would be surprising given brand loyalty and the built-up experience contractors have with the brands. Most contractors are unlikely to recommend a cheaper product to capture some incremental margin—especially if installation takes longer or does not go as planned. Contractors also have the potential to suffer some reputational risk if the product installed doesn’t live up to customer expectations.

The commercial water heater market is an area AOS has dominated, holding roughly 2x the market share of its next-closest peer, Rheem. Figure AG below shows market share for the US commercial market from 2014 to 2022. AOS entered the commercial water heater market with the acquisition of Lochinvar for $418 million in 2011. This implied a 2.1x sales multiple and a 9.2x EV/EBITDA (TTM) or 7.3x EV/EBITDA if it was able to meet the midpoint of targeted synergies of $10 million to $15 million . From a strategic perspective, the deal expanded AOS’s core product offerings to include high-efficiency boiler technology. The commercial boiler market was in the process of undergoing a significant shift away from lower-efficiency boilers and toward high-efficiency condensing technology, which was expected to continue gaining share. A historical five-year sales CAGR of about 8% illustrated attractive trends, and incremental distribution from AOS had the potential to increase this in the future. At the time, Lochinvar was also reselling Bradford White residential water heater products to its customer base, and these volumes were planned to be replaced with AOS products over time.

The next question could well be “Why has AOS’s market share remained so dominant in the commercial market over time?” As I understand it, Lochinvar was effectively a first mover in rolling out condensing technology and has continued to invest in the portfolio to keep it on very advantaged terms. Lochinar is effectively the industry standard in many places. It also continued to participate in a market-wide shift toward these higher-efficiency units, and the timing of the acquisition was just about perfect, as this trend was about to accelerate. This is illustrated in Figure AH.

Earlier in Lochinvar’s history, the company had its factory workers and sales representatives work aggressively to build relationships with mechanical and plumbing engineers and educate them about the benefits of its technology. As about 80% of commercial demand is driven by these indirect representatives, winning them over and retaining this reputation is very important. Figure AI below shows how this dynamic has persisted into 2023. One industry expert believed AOS’s win rate on new projects was upward of 50%, however, the magnitude of advantage seems to vary by region. As of late 2023, AOS believes it has a number one or two market position with roughly 80% of the representatives that carry the Lochinvar products. The company has also created tools like the LochSpec Selection tool to help make its partners’ selection efforts easier. Also, as most commercial sales go through wholesale, price comparisons are more limited and in turn provide better economics.

Commercial customers also tend to be much more demanding, requiring higher levels of service, maintenance, and even proactive replacements. A typical homeowner will rarely proactively replace a water heater, but a restaurant, hospital, or commercial laundry facility is going to schedule this in advance of an asset failing. Having an impaired asset like this can take out the revenue-generating capacity of a business for days or weeks if equipment can’t be easily sourced. Taking these factors into account, unit economics should be much better due to less competition, more niche needs, and higher thresholds for reliability and uptime. All these characteristics should allow for more pricing power than the residential market.
M&A and Capital Allocation
AOS’s framework and process for M&A appears to be plain vanilla compared to a number of other industrials. I don’t get the sense that any of the deals are complete blunders or huge home runs, excluding Lochinvar, which was completed over a decade ago. Figure AJ below illustrates how AOS has strategically thought about M&A—and of note, it hasn’t really changed in 15 years. Acquisitions are needed to add exposure to new geographic markets, adjacent markets, or markets that help expand or grow its core markets—water heating and water treatment.

While AOS has deployed capital into each of these categories, it is hard to call out any big successes in recent years. ROW segment sales peaked in 2018 and have continued to trend lower into 2024. The adjacent portfolio opportunities haven’t really scaled up—the air purifier products were an opportunity that had huge potential back in 2018. But since the Chinese government announced its war on pollution, this opportunity has largely evaporated. More recently, the company has called out opportunities in range hoods, dishwashers, stoves, and steam ovens. But to me the white goods market seems like a bit of a stretch. Even with a number of these introductions into China since 2019, total sales have stagnated, which indicates either little traction with recent launches or bigger problems in its core business. Not great. Midea and Haier amongst other competitors also have formidable scale, distribution and service advantages which seem difficult to compete against.
On the other hand, the only success to call out would be the scaling up of the water treatment business, which has grown at roughly a 12% CAGR on a trailing-five-years basis (including M&A contributions) to $248 million in sales in 2024. It’s a small piece, though, at only 6% of total sales or about 8% of NA segment sales. Trends are good, however, and there are no indications of a deceleration in the opportunity longer term. Management is targeting $500 million in sales by 2028 driven by organic growth of 10% to 12%, which is more than 2x annual market growth of 4% to 5%. Bolt-on acquisitions are expected to contribute another 5% to annual sales growth as it consolidates more regional players and vertically integrates the portfolio. However, as shown in Figure AK , channel complexity, number of products sold, and a more fragmented market structure may limit EBIT margins in reaching the mid-20s it has been able to achieve in North America. AOS management believes that water treatment will get to mid-teen levels by 2028, but longer term, I’m less certain where it will mature.

Figure AL below outlines all acquisitions since 2009 as well as the sole divestiture. In 2010, the sale of the electric motor business was a huge deal, as this truly cleaned up the portfolio to become a pure-play water technology business. Thematically, all the acquisitions below are of water technology businesses—either treatment or heating. The number of deals skews heavily toward water treatment in recent years, but this appears to be more of a function of the fragmented structure of the water treatment industry, where the sheer number of deals available is much higher. AOS also appears to be a favored acquirer of family-owned businesses, which I believe should be positive for the company’s longer-term reinvestment runway.

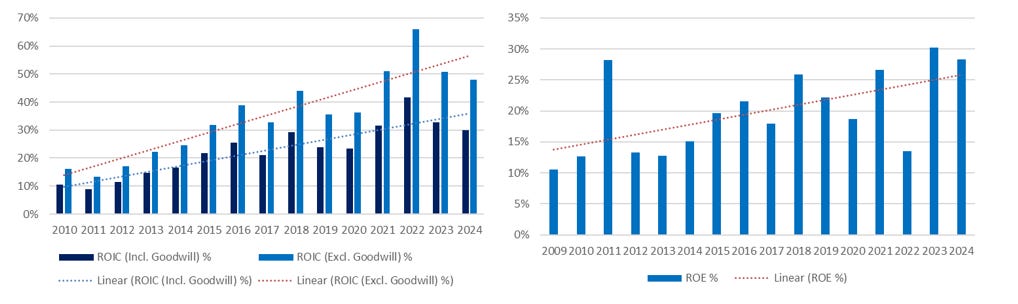
As shown above, multiples paid for either water treatment or water heating acquisitions have been in a relatively tight range of 1.0x to 2.3x sales. Not only have multiples paid been reasonable relative to AOS’s trading history and alternative options; these investments appear to have generated decent results on incremental capital deployed. Below in Figure AM , we look at return on invested capital (ROIC), including and excluding goodwill—for the trends of both measures are very clearly improving from low-double-digit/mid-teen levels to more than 30%. Drivers of this uplift were both improving net operating profit after tax (NOPAT) margins, which grew from about 5% to 15%, and improving invested capital turnover, which increased from 1.6x to 2.0x. Return on equity (ROE) trends paint a similar picture of stable-to-improving returns over the historical period. The core business continues to deliver attractive performance, and it doesn’t appear M&A has hurt trends.
Management and Governance
As of March 2025, the founding Smith family continues to control the business through its stake in the Smith Family Voting Trust. It controls approximately 97% of Class A shares, rendering the company a “controlled” company by NYSE market standards. That the firm is still in this family’s hands after 150 years of operations is remarkable. While it’s hard to quantify the impacts of this ownership culture on day-to-day operations, I ultimately believe it is positive. A longer-term owner should be willing to make more efforts to retain employees, invest in long-term projects, and take more steps to build its brand/reputation. As shown below in Figure AN , Glassdoor overall ratings and the recommendations-to-friends rating for AOS screen the best among its peers. Its CEO approval rating is effectively in line with Rheem and well ahead of Bradford White.

The incentive program AOS has set up for managers looks reasonable in the key areas. The total compensation framework is made up of base salaries, annual incentives, and longer-term incentives. Annual incentives are based on an 80% weight of EBIT and 20% of net sales relative to corporate targets. Business unit leaders have annual incentives more closely tied to the performance of their segment. Long-term incentives are paid out in restricted stock, “performance cash,” and performance stock if financial and strategic goals are met. Restricted stock units vest over a three-year period and require a minimum average ROE of 5%, which is unfortunately very low. The “performance cash” payout is tied to achieving a ROIC relative to a trailing five-year average ROIC achieved by the company. Here the targets seem much more appropriate, with a 200% payout for a 36.8% ROIC and a 100% payout for a 30.8% ROIC. This range was determined by the trailing five-year median ROIC of the S&P 500 Industrials Sector Index. The last piece is driven by water usage relative to corporate targets and historical consumption. In 2025, the major pieces of this program remain largely unchanged, with the water consumption target shifting to a landfill diversion target for the next three years. Graphs from the last proxy statement summarize the overall compensation philosophy and show a strong tie to the overall performance of the company, as shown below in Figure AO .

Strategically, I don’t have a ton of issues with how management has executed. Perhaps they could have scaled the tankless business faster, but a lack of technical expertise and a smaller current market size might make this a better opportunity down the road. The more fragmented market structure and higher levels of competition from foreign entities might make this market less attractive, but I don’t have much data to quantify this. The ROW expansion seems to have gone sideways for the most part, but that element has been largely unpredictable. AOS has restructured the ROW business for the newer low-volume environment and has been reinvesting much closer to maintenance levels, which looks like the right approach until overall visibility improves. This doesn’t scream countercyclical but seems like a reasonable rationale from what I can tell.
From a financial perspective, the biggest area for improvement AOS should consider is to run the balance sheet with some modest leverage. The company widely communicates that 80% to 85% of volumes in the NA market are replacement-driven sales, and this should drive a ton of cash flow stability over a market cycle. Running the business at 2x ND/EBITDA should hardly raise the true risk profile of the equity and implies the company could buy back more than 10% of the business today. As shown below in Figure AP , management has consistently returned capital to shareholders through buybacks and dividends—more can be done, but it’s a start. Future optionality associated with an acquisition is also good justification for keeping more cash than is needed, but the odds of getting a larger deal done in the next few years is much higher.

What’s the Market Pricing In?
To help understand what the market is pricing in, I adjusted the model assumptions to arrive at an intrinsic value close to the current share price. Many of these assumptions look quite reasonable given the current outlook and my understanding of the business.
To start, I assume that organic revenues modestly decline in 2025, grow at more than 4% for three years after that, and then gradually decelerate. Let’s say the near-term decline is driven by a weaker housing market (new starts), with some moderate offsets into 2029 from pricing, and new regulations that help drive a better mix in NA WHs . Offsetting this could be some moderate share losses in the tankless market, where the new product launch may not scale up to management expectations. Usually end markets have grown 1% to 2%, with incremental swing factors of inventory or channel shifts and pricing power accounting for the rest. This historical algorithm should remain in place, as far as I can tell. Figure AQ below highlights revenue expectations for the business in this scenario with roughly a 3.8% CAGR.

To get to the current price, the historical trend of margin increases can’t be extrapolated forward. Recall that the NA segment margins expanded from about 10% in 2012 to 24% in 2024. During this time frame, the company successfully captured pricing on water heaters, consolidated competitors, and scaled up its higher-margin commercial business. These dynamics seem to have largely played out for the water heater/boiler market. However, a similar situation could play out over the next 10-plus years in the water treatment market—but this is a much smaller part of the business, so it is unlikely to shift overall results. However, the longer-term margin profile for water treatment is also unclear—it may be worse, or it may be better than NA WH. Through incremental modernizations of the manufacturing base and gradually increasing utilization, it feels reasonable to expect modest margin improvement in NA over the next four years.
However, there are some good reasons why margins may not expand. In the ROW segment, the economic environment in China has remained weak and doesn’t appear to be improving on the back of recent stimulus. Tariffs appear to put further pressure on region and broader consumer confidence. Prior to all this, management has communicated to the market that without a better environment, volumes aren’t likely to grow. Back in 2017, about 90% of the products sold in China were premium; this share has fallen to 45% to 60%, and even after this reset, growth expectations are just 4% to 6% going forward. This seems quite high over the near term especially as China’s real estate market continues to undergo a significant correction. This guidance implies limited volume growth even after moving down market, and pricing power is weaker in the economy/mid-sized area of the market. In addition to this, AOS has been diversifying its portfolio to include sales of more white goods (home appliances) and given the market structure (more fragmented) and more limited scale, it’s hard to envision that margins will be as attractive in this area. But regions like India, which are less than 10% of ROW segment sales, have clearer growth trends. The recent acquisition of Pureit should help the company scale the water treatment business faster in this market. If it is able to leverage technology or products from other markets, scaling up could also go much faster. But it’s currently small and may not move the results in a material way for many years to come. Overall, I believe ROW margins will recover modestly as capacity is rightsized for the new volume environment and select product lines or geographies modestly grow over the forecast period.

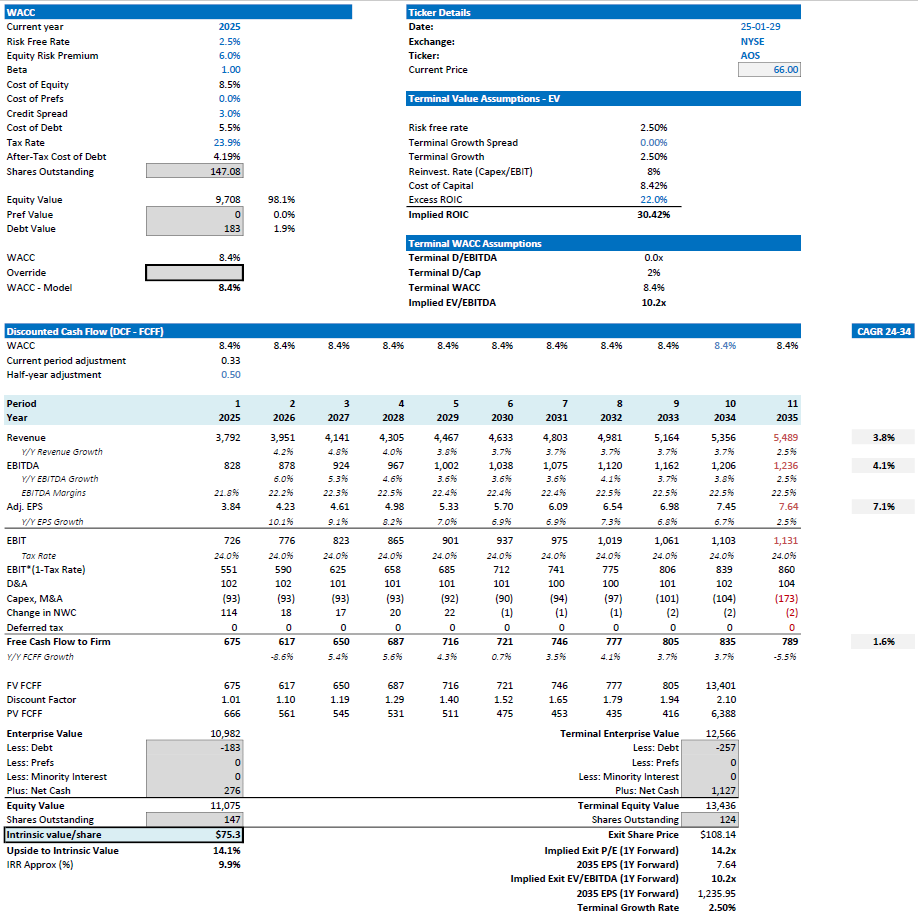
Using these assumptions, I get to an approximate 5% EBIT CAGR from 2024 to 2035, as shown in Figure AR above. This incorporates an EBIT margin improvement of 210 basis points to 20.7% by 2035. Also, it does not incorporate M&A, which it would have ample capacity to do. This scenario generates about $9.1 billion in cash flow from operations, of which about $1 billion is spent on CapEx, about $6 billion is returned to shareholders, and the remainder builds on the balance sheet.
In the DCF model, we use an 8.5% cost of equity, a 6.0% cost of debt, and a terminal ROIC of about 18%. Using these assumptions, the terminal EV/EBITDA multiple is about 10.1x and the P/E is about 14.1x, which is slightly below the roughly 10.7x and 16.0x multiples, respectively, that these trade at today.
I wouldn’t be too surprised if this scenario were to play out. Most of all, it’s hard to see how a ton of incremental upside can be generated without faster growth or even more margin improvement going forward. M&A activity could surprise, and that’s likely where I might be too conservative. But big deals have been hard to find, and they can carry more risks. Either way, the above scenario implies an intrinsic value-per-share estimate of about $75.00 and an IRR of about 10%. Figure AS below outlines a summary of my DCF output.
Conclusion
While the AOS business may not be very exciting, it has generated very good ROICs in a mature industry with limited competition. The CapEx light business model combined with its NA business operating in an attractive oligopoly with pricing power has driven good historical returns. However, the reinvestment opportunities seem limited, and whether any of the newer geographies or adjacent product portfolios will be able to generate returns nearly as high is uncertain. The company has scale and intellectual property advantages that are likely to persist, but this all appears widely known and priced in.
In my view, market expectations for the key drivers implied by the current price are about right. The risk of loss should be very low given the underlying nature of the business. But I see roughly 10% returns as the highest-likelihood scenario, which feels far too low if I had cash to allocate. Given these dynamics, I don’t own AOS and have no immediate plans to add this into my portfolio.
If you have any questions or comments on anything I’ve written above I would love to discuss them with you. Please comment below or reach out on Twitter/X or via email at icemancapital@gmail.com.